import pandas as pd
import numpy as np
import matplotlib.pyplot as plt
from plotnine import *Tidydata 심화 실습
pandas
plotnine
Tidydata를 만드는 방법의 모든(?) 것
해당 포스트는 전북대학교 통계학과 최규빈 교수님의 강의내용을 토대로 재구성되었음을 알립니다.
1. 라이브러리 imports
2. 사전학습
pd.concat()
df1 = pd.DataFrame({'A':[1,2,3],'B':[2,3,4]})
df2 = pd.DataFrame({'A':[-1,-2,-3],'B':[-2,-3,-4]})display("df1", df1)
display("df2", df2)'df1'| A | B | |
|---|---|---|
| 0 | 1 | 2 |
| 1 | 2 | 3 |
| 2 | 3 | 4 |
'df2'| A | B | |
|---|---|---|
| 0 | -1 | -2 |
| 1 | -2 | -3 |
| 2 | -3 | -4 |
위 두 개의 데이터프레임을 합치고 싶다면?
display(pd.concat([df1, df2], axis = 1))
display(pd.concat([df1, df2], axis = 0).reset_index(drop = True))| A | B | A | B | |
|---|---|---|---|---|
| 0 | 1 | 2 | -1 | -2 |
| 1 | 2 | 3 | -2 | -3 |
| 2 | 3 | 4 | -3 | -4 |
| A | B | |
|---|---|---|
| 0 | 1 | 2 |
| 1 | 2 | 3 |
| 2 | 3 | 4 |
| 3 | -1 | -2 |
| 4 | -2 | -3 |
| 5 | -3 | -4 |
### df.merge()
- 사이즈가 맞지 않는 두 데이터프레임의 정보를 결합
big = pd.DataFrame({'department':['A','A','B','B'], 'gender':['male','female','male','female'],'count':[1,2,3,1]})
small = pd.DataFrame({'department':['A','B'], 'total':[3,4]})

display('big', big) ## title을 달아주고 아래 산출
display('small', small)'big'| department | gender | count | |
|---|---|---|---|
| 0 | A | male | 1 |
| 1 | A | female | 2 |
| 2 | B | male | 3 |
| 3 | B | female | 1 |
'small'| department | total | |
|---|---|---|
| 0 | A | 3 |
| 1 | B | 4 |
display(big.merge(small))  ## 큰 거를 기준으로 작은거 병합
display(small.merge(big))  ## 작은거를 기준으로 큰거를 병합
## 사실 둘 다 비슷하긴 함| department | gender | count | total | |
|---|---|---|---|---|
| 0 | A | male | 1 | 3 |
| 1 | A | female | 2 | 3 |
| 2 | B | male | 3 | 4 |
| 3 | B | female | 1 | 4 |
| department | total | gender | count | |
|---|---|---|---|---|
| 0 | A | 3 | male | 1 |
| 1 | A | 3 | female | 2 |
| 2 | B | 4 | male | 3 |
| 3 | B | 4 | female | 1 |
df.applymap()
np.random.seed(43052)
df = pd.DataFrame({'A':np.random.rand(3), 'B':np.random.rand(3)})
df| A | B | |
|---|---|---|
| 0 | 0.817682 | 0.619777 |
| 1 | 0.049532 | 0.122541 |
| 2 | 0.838686 | 0.117128 |
0.5보다 크면 yes, 0.5보다 작으면 no로 바꾸고 싶다면…
df.applymap(lambda x : 'yes' if x > 0.5 else 'no')| A | B | |
|---|---|---|
| 0 | yes | yes |
| 1 | no | no |
| 2 | yes | no |
### D. df.astype()
- 데이터프레임이나 시리즈의 형식을 일괄적으로 변경
df = pd.DataFrame({'A':[0,1,2],'B':[4,5,6]})
df| A | B | |
|---|---|---|
| 0 | 0 | 4 |
| 1 | 1 | 5 |
| 2 | 2 | 6 |
df.astype(float)| A | B | |
|---|---|---|
| 0 | 0.0 | 4.0 |
| 1 | 1.0 | 5.0 |
| 2 | 2.0 | 6.0 |
E. 데이터프레임 열의 형식
- info()에서의 형식, object는 일괄적으로 문자형이라는 것을 의미하는 게 아님.
np.random.seed(43052)
df = pd.DataFrame({'A':['1','2','0','1',2], 'B':['2','3','0','0',0]})  ## integer가 포함되어 있다.
df.info()
<class 'pandas.core.frame.DataFrame'>
RangeIndex: 5 entries, 0 to 4
Data columns (total 2 columns):
# Column Non-Null Count Dtype
--- ------ -------------- -----
0 A 5 non-null object
1 B 5 non-null object
dtypes: object(2)
memory usage: 208.0+ bytes- column의 이름이 이상하게 들어가 있는 경우도 있음.
df = pd.DataFrame({('A',''):[0,0,0], ('B',''):[1,1,1]})
df| A | B | |
|---|---|---|
| 0 | 0 | 1 |
| 1 | 0 | 1 |
| 2 | 0 | 1 |
df['A']
df[('A', '')]
0 0
1 0
2 0
Name: (A, ), dtype: int64놀랍게도 둘은 같다. 인덱스를 다시 설정해주는 편이 정신건강에 이로움
df.columns ## 쓸모없는 멀티인덱스MultiIndex([('A', ''),
('B', '')],
)3. 실습 : 에너지 사용량 시각화
- 문제
pd.read_csv('https://raw.githubusercontent.com/guebin/DV2022/main/posts/Energy/Seoul2019.csv')| 지역 | 건물동수 | 연면적 | 에너지사용량(TOE)/전기 | 에너지사용량(TOE)/도시가스 | 에너지사용량(TOE)/지역난방 | |
|---|---|---|---|---|---|---|
| 0 | 종로구 | 17,851 | 9,204,140 | 63,492 | 76,653 | 799 |
| 1 | 중구 | 10,383 | 10,078,848 | 79,223 | 68,210 | 497 |
| 2 | 용산구 | 17,138 | 10,756,612 | 51,229 | 79,805 | 11,128 |
| 3 | 성동구 | 13,980 | 11,804,313 | 59,832 | 99,986 | 0 |
| 4 | 광진구 | 21,556 | 12,272,738 | 68,756 | 123,447 | 0 |
| 5 | 동대문구 | 21,794 | 12,664,554 | 65,913 | 111,420 | 0 |
| 6 | 중랑구 | 23,950 | 15,182,802 | 59,370 | 109,284 | 7,442 |
| 7 | 성북구 | 27,112 | 15,938,807 | 77,007 | 148,376 | 0 |
| 8 | 강북구 | 23,334 | 9,458,987 | 47,731 | 100,045 | 0 |
| 9 | 도봉구 | 13,168 | 10,644,704 | 44,985 | 90,379 | 5,268 |
| 10 | 노원구 | 9,704 | 17,197,086 | 77,010 | 94,340 | 50,859 |
| 11 | 은평구 | 25,200 | 14,735,131 | 75,914 | 130,159 | 14,370 |
| 12 | 서대문구 | 17,651 | 12,559,425 | 65,164 | 111,542 | 6,330 |
| 13 | 마포구 | 18,844 | 15,024,186 | 92,453 | 114,931 | 20,148 |
| 14 | 양천구 | 14,690 | 15,428,339 | 70,721 | 82,857 | 49,258 |
| 15 | 강서구 | 20,446 | 20,641,866 | 86,809 | 128,786 | 35,896 |
| 16 | 구로구 | 17,204 | 13,509,894 | 59,916 | 120,457 | 2,963 |
| 17 | 금천구 | 12,135 | 7,420,441 | 34,791 | 69,814 | 732 |
| 18 | 영등포구 | 18,133 | 14,914,027 | 87,480 | 114,238 | 13,531 |
| 19 | 동작구 | 20,102 | 13,612,946 | 66,811 | 132,285 | 899 |
| 20 | 관악구 | 26,460 | 14,997,859 | 85,416 | 158,543 | 0 |
| 21 | 서초구 | 12,856 | 21,560,285 | 135,491 | 121,437 | 38,866 |
| 22 | 강남구 | 16,129 | 29,961,585 | 180,121 | 149,045 | 83,459 |
| 23 | 송파구 | 19,331 | 26,573,343 | 139,117 | 143,601 | 71,954 |
| 24 | 강동구 | 16,636 | 15,048,315 | 70,341 | 121,931 | 11,921 |
에너지 사용량은 2018년부터 2021년까지의 기간 동안 서울, 부산 등 여러 지역에 대해 정리되어 있으며, 아래 주소 형식으로 저장되어 있다.
https://raw.githubusercontent.com/guebin/DV2022/main/posts/Energy/Seoul2018.csv
https://raw.githubusercontent.com/guebin/DV2022/main/posts/Energy/Seoul2019.csv
https://raw.githubusercontent.com/guebin/DV2022/main/posts/Energy/Seoul2020.csv
https://raw.githubusercontent.com/guebin/DV2022/main/posts/Energy/Seoul2021.csv
...
https://raw.githubusercontent.com/guebin/DV2022/main/posts/Energy/Busan2018.csv
https://raw.githubusercontent.com/guebin/DV2022/main/posts/Energy/Busan2019.csv
https://raw.githubusercontent.com/guebin/DV2022/main/posts/Energy/Busan2020.csv
https://raw.githubusercontent.com/guebin/DV2022/main/posts/Energy/Busan2021.csv- 아래의
url,prov를 참고하여 모든 자료를 불러온 뒤pd.concat()을 이용하여 하나의 df로 합쳐라.
url = 'https://raw.githubusercontent.com/guebin/DV2022/main/posts/Energy/{}.csv'

prov = ['Seoul', 'Busan', 'Daegu', 'Incheon',
        'Gwangju', 'Daejeon', 'Ulsan', 'Sejongsi',
        'Gyeonggi-do', 'Gangwon-do', 'Chungcheongbuk-do',
        'Chungcheongnam-do', 'Jeollabuk-do', 'Jeollanam-do',
        'Gyeongsangbuk-do', 'Gyeongsangnam-do', 'Jeju-do']
1. 풀이
url.format('Seoul2018') ## 이런 식으로 하나하나 리스트로 지정해줘야 함'https://raw.githubusercontent.com/guebin/DV2022/main/posts/Energy/Seoul2018.csv'[url.format(region + str(year)) for year in range(2018,2022) for region in prov]['https://raw.githubusercontent.com/guebin/DV2022/main/posts/Energy/Seoul2018.csv',
'https://raw.githubusercontent.com/guebin/DV2022/main/posts/Energy/Busan2018.csv',
'https://raw.githubusercontent.com/guebin/DV2022/main/posts/Energy/Daegu2018.csv',
'https://raw.githubusercontent.com/guebin/DV2022/main/posts/Energy/Incheon2018.csv',
'https://raw.githubusercontent.com/guebin/DV2022/main/posts/Energy/Gwangju2018.csv',
'https://raw.githubusercontent.com/guebin/DV2022/main/posts/Energy/Daejeon2018.csv',
'https://raw.githubusercontent.com/guebin/DV2022/main/posts/Energy/Ulsan2018.csv',
'https://raw.githubusercontent.com/guebin/DV2022/main/posts/Energy/Sejongsi2018.csv',
'https://raw.githubusercontent.com/guebin/DV2022/main/posts/Energy/Gyeonggi-do2018.csv',
'https://raw.githubusercontent.com/guebin/DV2022/main/posts/Energy/Gangwon-do2018.csv',
'https://raw.githubusercontent.com/guebin/DV2022/main/posts/Energy/Chungcheongbuk-do2018.csv',
'https://raw.githubusercontent.com/guebin/DV2022/main/posts/Energy/Chungcheongnam-do2018.csv',
'https://raw.githubusercontent.com/guebin/DV2022/main/posts/Energy/Jeollabuk-do2018.csv',
'https://raw.githubusercontent.com/guebin/DV2022/main/posts/Energy/Jeollanam-do2018.csv',
'https://raw.githubusercontent.com/guebin/DV2022/main/posts/Energy/Gyeongsangbuk-do2018.csv',
'https://raw.githubusercontent.com/guebin/DV2022/main/posts/Energy/Gyeongsangnam-do2018.csv',
'https://raw.githubusercontent.com/guebin/DV2022/main/posts/Energy/Jeju-do2018.csv',
'https://raw.githubusercontent.com/guebin/DV2022/main/posts/Energy/Seoul2019.csv',
'https://raw.githubusercontent.com/guebin/DV2022/main/posts/Energy/Busan2019.csv',
'https://raw.githubusercontent.com/guebin/DV2022/main/posts/Energy/Daegu2019.csv',
'https://raw.githubusercontent.com/guebin/DV2022/main/posts/Energy/Incheon2019.csv',
'https://raw.githubusercontent.com/guebin/DV2022/main/posts/Energy/Gwangju2019.csv',
'https://raw.githubusercontent.com/guebin/DV2022/main/posts/Energy/Daejeon2019.csv',
'https://raw.githubusercontent.com/guebin/DV2022/main/posts/Energy/Ulsan2019.csv',
'https://raw.githubusercontent.com/guebin/DV2022/main/posts/Energy/Sejongsi2019.csv',
'https://raw.githubusercontent.com/guebin/DV2022/main/posts/Energy/Gyeonggi-do2019.csv',
'https://raw.githubusercontent.com/guebin/DV2022/main/posts/Energy/Gangwon-do2019.csv',
'https://raw.githubusercontent.com/guebin/DV2022/main/posts/Energy/Chungcheongbuk-do2019.csv',
'https://raw.githubusercontent.com/guebin/DV2022/main/posts/Energy/Chungcheongnam-do2019.csv',
'https://raw.githubusercontent.com/guebin/DV2022/main/posts/Energy/Jeollabuk-do2019.csv',
'https://raw.githubusercontent.com/guebin/DV2022/main/posts/Energy/Jeollanam-do2019.csv',
'https://raw.githubusercontent.com/guebin/DV2022/main/posts/Energy/Gyeongsangbuk-do2019.csv',
'https://raw.githubusercontent.com/guebin/DV2022/main/posts/Energy/Gyeongsangnam-do2019.csv',
'https://raw.githubusercontent.com/guebin/DV2022/main/posts/Energy/Jeju-do2019.csv',
'https://raw.githubusercontent.com/guebin/DV2022/main/posts/Energy/Seoul2020.csv',
'https://raw.githubusercontent.com/guebin/DV2022/main/posts/Energy/Busan2020.csv',
'https://raw.githubusercontent.com/guebin/DV2022/main/posts/Energy/Daegu2020.csv',
'https://raw.githubusercontent.com/guebin/DV2022/main/posts/Energy/Incheon2020.csv',
'https://raw.githubusercontent.com/guebin/DV2022/main/posts/Energy/Gwangju2020.csv',
'https://raw.githubusercontent.com/guebin/DV2022/main/posts/Energy/Daejeon2020.csv',
'https://raw.githubusercontent.com/guebin/DV2022/main/posts/Energy/Ulsan2020.csv',
'https://raw.githubusercontent.com/guebin/DV2022/main/posts/Energy/Sejongsi2020.csv',
'https://raw.githubusercontent.com/guebin/DV2022/main/posts/Energy/Gyeonggi-do2020.csv',
'https://raw.githubusercontent.com/guebin/DV2022/main/posts/Energy/Gangwon-do2020.csv',
'https://raw.githubusercontent.com/guebin/DV2022/main/posts/Energy/Chungcheongbuk-do2020.csv',
'https://raw.githubusercontent.com/guebin/DV2022/main/posts/Energy/Chungcheongnam-do2020.csv',
'https://raw.githubusercontent.com/guebin/DV2022/main/posts/Energy/Jeollabuk-do2020.csv',
'https://raw.githubusercontent.com/guebin/DV2022/main/posts/Energy/Jeollanam-do2020.csv',
'https://raw.githubusercontent.com/guebin/DV2022/main/posts/Energy/Gyeongsangbuk-do2020.csv',
'https://raw.githubusercontent.com/guebin/DV2022/main/posts/Energy/Gyeongsangnam-do2020.csv',
'https://raw.githubusercontent.com/guebin/DV2022/main/posts/Energy/Jeju-do2020.csv',
'https://raw.githubusercontent.com/guebin/DV2022/main/posts/Energy/Seoul2021.csv',
'https://raw.githubusercontent.com/guebin/DV2022/main/posts/Energy/Busan2021.csv',
'https://raw.githubusercontent.com/guebin/DV2022/main/posts/Energy/Daegu2021.csv',
'https://raw.githubusercontent.com/guebin/DV2022/main/posts/Energy/Incheon2021.csv',
'https://raw.githubusercontent.com/guebin/DV2022/main/posts/Energy/Gwangju2021.csv',
'https://raw.githubusercontent.com/guebin/DV2022/main/posts/Energy/Daejeon2021.csv',
'https://raw.githubusercontent.com/guebin/DV2022/main/posts/Energy/Ulsan2021.csv',
'https://raw.githubusercontent.com/guebin/DV2022/main/posts/Energy/Sejongsi2021.csv',
'https://raw.githubusercontent.com/guebin/DV2022/main/posts/Energy/Gyeonggi-do2021.csv',
'https://raw.githubusercontent.com/guebin/DV2022/main/posts/Energy/Gangwon-do2021.csv',
'https://raw.githubusercontent.com/guebin/DV2022/main/posts/Energy/Chungcheongbuk-do2021.csv',
'https://raw.githubusercontent.com/guebin/DV2022/main/posts/Energy/Chungcheongnam-do2021.csv',
'https://raw.githubusercontent.com/guebin/DV2022/main/posts/Energy/Jeollabuk-do2021.csv',
'https://raw.githubusercontent.com/guebin/DV2022/main/posts/Energy/Jeollanam-do2021.csv',
'https://raw.githubusercontent.com/guebin/DV2022/main/posts/Energy/Gyeongsangbuk-do2021.csv',
'https://raw.githubusercontent.com/guebin/DV2022/main/posts/Energy/Gyeongsangnam-do2021.csv',
'https://raw.githubusercontent.com/guebin/DV2022/main/posts/Energy/Jeju-do2021.csv']df = pd.concat([pd.read_csv(url.format(region + str(year))).assign(년도 = year, 시도 = region) for year in range(2018,2022) for region in prov], axis = 0)df| 지역 | 건물동수 | 연면적 | 에너지사용량(TOE)/전기 | 에너지사용량(TOE)/도시가스 | 에너지사용량(TOE)/지역난방 | 년도 | 시도 | |
|---|---|---|---|---|---|---|---|---|
| 0 | 종로구 | 17,929 | 9,141,777 | 64,818 | 82,015 | 111 | 2018 | Seoul |
| 1 | 중구 | 10,598 | 10,056,233 | 81,672 | 75,260 | 563 | 2018 | Seoul |
| 2 | 용산구 | 17,201 | 10,639,652 | 52,659 | 85,220 | 12,043 | 2018 | Seoul |
| 3 | 성동구 | 14,180 | 11,631,770 | 60,559 | 107,416 | 0 | 2018 | Seoul |
| 4 | 광진구 | 21,520 | 12,054,796 | 70,609 | 130,308 | 0 | 2018 | Seoul |
| ... | ... | ... | ... | ... | ... | ... | ... | ... |
| 19 | 함양군 | 12,505 | 1,509,149 | 6,328 | 3,164 | 0 | 2021 | Gyeongsangnam-do |
| 20 | 거창군 | 14,607 | 2,322,093 | 10,404 | 8,850 | 0 | 2021 | Gyeongsangnam-do |
| 21 | 합천군 | 16,039 | 1,612,734 | 7,587 | 0 | 0 | 2021 | Gyeongsangnam-do |
| 0 | 제주시 | 67,053 | 20,275,738 | 103,217 | 25,689 | 0 | 2021 | Jeju-do |
| 1 | 서귀포시 | 35,230 | 7,512,206 | 37,884 | 2,641 | 0 | 2021 | Jeju-do |
1000 rows × 8 columns
문자열을 pd.read_csv()에 넣어준 후, 컴프리헨션 된 리스트를 행 방향으로 concat했다. 또한 연도와 시도의 정보를 유지시켰다.
- 의미상 숫자형이지만, 문자형으로 입력이 된 자료를 모두 전처리하라.
df.info()<class 'pandas.core.frame.DataFrame'>
Index: 1000 entries, 0 to 1
Data columns (total 8 columns):
# Column Non-Null Count Dtype
--- ------ -------------- -----
0 지역 1000 non-null object
1 건물동수 1000 non-null object
2 연면적 1000 non-null object
3 에너지사용량(TOE)/전기 1000 non-null object
4 에너지사용량(TOE)/도시가스 1000 non-null object
5 에너지사용량(TOE)/지역난방 1000 non-null object
6 년도 1000 non-null int64
7 시도 1000 non-null object
dtypes: int64(1), object(7)
memory usage: 70.3+ KB지역, 시도의 경우 문자형으로 입력된 게 맞음. 하지만 나머지는 다 숫자형이 되어야 한다.
df.set_index(['지역', '년도', '시도']).applymap(lambda x : x.replace(',',''))AttributeError: 'int' object has no attribute 'replace'문자형이 아닌 숫자형인 녀석이 몇몇 있나보다.
df.set_index(['지역', '년도', '시도']).applymap(lambda x : str(x).replace(',','')).astype(int).reset_index().info()<class 'pandas.core.frame.DataFrame'>
RangeIndex: 1000 entries, 0 to 999
Data columns (total 8 columns):
# Column Non-Null Count Dtype
--- ------ -------------- -----
0 지역 1000 non-null object
1 년도 1000 non-null int64
2 시도 1000 non-null object
3 건물동수 1000 non-null int32
4 연면적 1000 non-null int32
5 에너지사용량(TOE)/전기 1000 non-null int32
6 에너지사용량(TOE)/도시가스 1000 non-null int32
7 에너지사용량(TOE)/지역난방 1000 non-null int32
dtypes: int32(5), int64(1), object(2)
memory usage: 43.1+ KB자료의 형식이 알맞게 설정되었다.
년도에는 쉼표가 없으므로 integer로 바꿈(여기선 애초에 숫자형으로 들어가긴 함)
년도와 시도, 지역을 배제(문자형)
혹시라도 integer인 녀석들을 string으로 변경 후 문자열 바꾸는 메소드를 통해
,를 제거, 인덱스 초기화열의 이름을 아래와 같이 바꿔라.
name_dict = {
    '년도': 'Year',
    '시도': 'Prov',
    '지역': 'Reg',
    '건물동수': 'BldgCount',
    '연면적': 'Area',
    '에너지사용량(TOE)/전기': 'Elec',
    '에너지사용량(TOE)/도시가스': 'Gas',
    '에너지사용량(TOE)/지역난방': 'Heat'
}
딕셔너리가 주어졌으므로 그냥 바꾸면 된다.
df.set_index(['지역', '년도', '시도']).applymap(lambda x : str(x).replace(',','')).astype(int).reset_index()\
.rename(name_dict, axis = 1) ## axis를 꼭 지정해주자.| Reg | Year | Prov | BldgCount | Area | Elec | Gas | Heat | |
|---|---|---|---|---|---|---|---|---|
| 0 | 종로구 | 2018 | Seoul | 17929 | 9141777 | 64818 | 82015 | 111 |
| 1 | 중구 | 2018 | Seoul | 10598 | 10056233 | 81672 | 75260 | 563 |
| 2 | 용산구 | 2018 | Seoul | 17201 | 10639652 | 52659 | 85220 | 12043 |
| 3 | 성동구 | 2018 | Seoul | 14180 | 11631770 | 60559 | 107416 | 0 |
| 4 | 광진구 | 2018 | Seoul | 21520 | 12054796 | 70609 | 130308 | 0 |
| ... | ... | ... | ... | ... | ... | ... | ... | ... |
| 995 | 함양군 | 2021 | Gyeongsangnam-do | 12505 | 1509149 | 6328 | 3164 | 0 |
| 996 | 거창군 | 2021 | Gyeongsangnam-do | 14607 | 2322093 | 10404 | 8850 | 0 |
| 997 | 합천군 | 2021 | Gyeongsangnam-do | 16039 | 1612734 | 7587 | 0 | 0 |
| 998 | 제주시 | 2021 | Jeju-do | 67053 | 20275738 | 103217 | 25689 | 0 |
| 999 | 서귀포시 | 2021 | Jeju-do | 35230 | 7512206 | 37884 | 2641 | 0 |
1000 rows × 8 columns
- 아래와 같은 그림을 시각화하라.
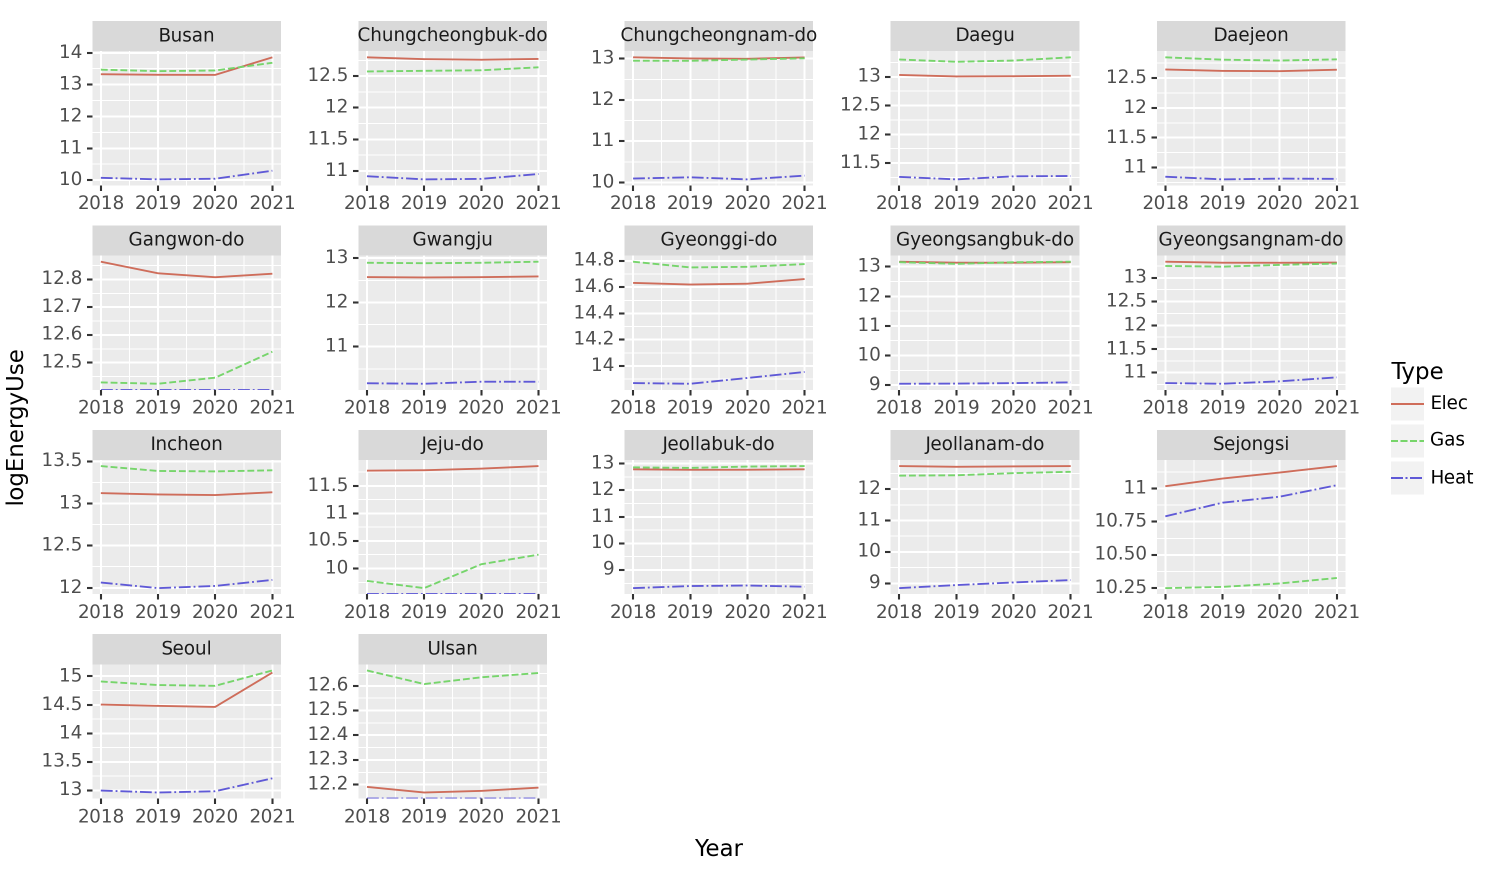
가로축이 Year, 세로축이 LogEnergyUse(에너지 사용량에 log를 취한 것)이고, Region으로 면분할했으며, Type으로 라인의 색상을 구분했다.
df.set_index(['지역', '년도', '시도']).applymap(lambda x : str(x).replace(',','')).astype(int).reset_index()\
.rename(name_dict, axis = 1)| Reg | Year | Prov | BldgCount | Area | Elec | Gas | Heat | |
|---|---|---|---|---|---|---|---|---|
| 0 | 종로구 | 2018 | Seoul | 17929 | 9141777 | 64818 | 82015 | 111 |
| 1 | 중구 | 2018 | Seoul | 10598 | 10056233 | 81672 | 75260 | 563 |
| 2 | 용산구 | 2018 | Seoul | 17201 | 10639652 | 52659 | 85220 | 12043 |
| 3 | 성동구 | 2018 | Seoul | 14180 | 11631770 | 60559 | 107416 | 0 |
| 4 | 광진구 | 2018 | Seoul | 21520 | 12054796 | 70609 | 130308 | 0 |
| ... | ... | ... | ... | ... | ... | ... | ... | ... |
| 995 | 함양군 | 2021 | Gyeongsangnam-do | 12505 | 1509149 | 6328 | 3164 | 0 |
| 996 | 거창군 | 2021 | Gyeongsangnam-do | 14607 | 2322093 | 10404 | 8850 | 0 |
| 997 | 합천군 | 2021 | Gyeongsangnam-do | 16039 | 1612734 | 7587 | 0 | 0 |
| 998 | 제주시 | 2021 | Jeju-do | 67053 | 20275738 | 103217 | 25689 | 0 |
| 999 | 서귀포시 | 2021 | Jeju-do | 35230 | 7512206 | 37884 | 2641 | 0 |
1000 rows × 8 columns
사용해야 할 것은 Prov, Year, Elec Gas Heat.
df.set_index(['지역', '년도', '시도']).applymap(lambda x : str(x).replace(',','')).astype(int).reset_index()\
.rename(name_dict, axis = 1)\
.set_index(['Prov', 'Year']).loc[:, ['Elec', 'Gas', 'Heat']].stack().reset_index()| Prov | Year | level_2 | 0 | |
|---|---|---|---|---|
| 0 | Seoul | 2018 | Elec | 64818 |
| 1 | Seoul | 2018 | Gas | 82015 |
| 2 | Seoul | 2018 | Heat | 111 |
| 3 | Seoul | 2018 | Elec | 81672 |
| 4 | Seoul | 2018 | Gas | 75260 |
| ... | ... | ... | ... | ... |
| 2995 | Jeju-do | 2021 | Gas | 25689 |
| 2996 | Jeju-do | 2021 | Heat | 0 |
| 2997 | Jeju-do | 2021 | Elec | 37884 |
| 2998 | Jeju-do | 2021 | Gas | 2641 |
| 2999 | Jeju-do | 2021 | Heat | 0 |
3000 rows × 4 columns
사용할 두 개의 열을 골라주고, 에너지 관련 세 개 열을 long data로 변환했다.
df.set_index(['지역', '년도', '시도']).applymap(lambda x : str(x).replace(',','')).astype(int).reset_index()\
.rename(name_dict, axis = 1)\
.set_index(['Prov', 'Year']).loc[:, ['Elec', 'Gas', 'Heat']].stack().reset_index()\
.rename({'level_2' : 'Type', 0 : 'EnergyUse'}, axis = 1)| Prov | Year | Type | EnergyUse | |
|---|---|---|---|---|
| 0 | Seoul | 2018 | Elec | 64818 |
| 1 | Seoul | 2018 | Gas | 82015 |
| 2 | Seoul | 2018 | Heat | 111 |
| 3 | Seoul | 2018 | Elec | 81672 |
| 4 | Seoul | 2018 | Gas | 75260 |
| ... | ... | ... | ... | ... |
| 2995 | Jeju-do | 2021 | Gas | 25689 |
| 2996 | Jeju-do | 2021 | Heat | 0 |
| 2997 | Jeju-do | 2021 | Elec | 37884 |
| 2998 | Jeju-do | 2021 | Gas | 2641 |
| 2999 | Jeju-do | 2021 | Heat | 0 |
3000 rows × 4 columns
이름을 바꾸고…
df.set_index(['지역', '년도', '시도']).applymap(lambda x : str(x).replace(',','')).astype(int).reset_index()\
.rename(name_dict, axis = 1)\
.set_index(['Prov', 'Year']).loc[:, ['Elec', 'Gas', 'Heat']].stack().reset_index()\
.rename({'level_2' : 'Type', 0 : 'EnergyUse'}, axis = 1)\
.pivot_table(index = ['Prov', 'Year', 'Type'], values = 'EnergyUse', aggfunc = 'sum').reset_index()| Prov | Year | Type | EnergyUse | |
|---|---|---|---|---|
| 0 | Busan | 2018 | Elec | 613522 |
| 1 | Busan | 2018 | Gas | 708240 |
| 2 | Busan | 2018 | Heat | 23694 |
| 3 | Busan | 2019 | Elec | 602980 |
| 4 | Busan | 2019 | Gas | 675882 |
| ... | ... | ... | ... | ... |
| 199 | Ulsan | 2020 | Gas | 306896 |
| 200 | Ulsan | 2020 | Heat | 0 |
| 201 | Ulsan | 2021 | Elec | 196412 |
| 202 | Ulsan | 2021 | Gas | 312276 |
| 203 | Ulsan | 2021 | Heat | 0 |
204 rows × 4 columns
지역별로 중복되는 것들을 더했다.
df.set_index(['지역', '년도', '시도']).applymap(lambda x : str(x).replace(',','')).astype(int).reset_index()\
.rename(name_dict, axis = 1)\
.set_index(['Prov', 'Year']).loc[:, ['Elec', 'Gas', 'Heat']].stack().reset_index()\
.rename({'level_2' : 'Type', 0 : 'EnergyUse'}, axis = 1)\
.pivot_table(index = ['Prov', 'Year', 'Type'], values = 'EnergyUse', aggfunc = 'sum').reset_index()\
.assign(LogEnergyUse = lambda _df : _df.EnergyUse.apply(np.log))| Prov | Year | Type | EnergyUse | LogEnergyUse | |
|---|---|---|---|---|---|
| 0 | Busan | 2018 | Elec | 613522 | 13.326971 |
| 1 | Busan | 2018 | Gas | 708240 | 13.470538 |
| 2 | Busan | 2018 | Heat | 23694 | 10.072977 |
| 3 | Busan | 2019 | Elec | 602980 | 13.309639 |
| 4 | Busan | 2019 | Gas | 675882 | 13.423774 |
| ... | ... | ... | ... | ... | ... |
| 199 | Ulsan | 2020 | Gas | 306896 | 12.634264 |
| 200 | Ulsan | 2020 | Heat | 0 | -inf |
| 201 | Ulsan | 2021 | Elec | 196412 | 12.187970 |
| 202 | Ulsan | 2021 | Gas | 312276 | 12.651643 |
| 203 | Ulsan | 2021 | Heat | 0 | -inf |
204 rows × 5 columns
그리고 로그를 취해준 것을 새로운 열로 할당해줬다. 이정도면 타이디데이터라 할 만 하다.
tidydata = df.set_index(['지역', '년도', '시도']).applymap(lambda x : str(x).replace(',','')).astype(int).reset_index()\
.rename(name_dict, axis = 1)\
.set_index(['Prov', 'Year']).loc[:, ['Elec', 'Gas', 'Heat']].stack().reset_index()\
.rename({'level_2' : 'Type', 0 : 'EnergyUse'}, axis = 1)\
.pivot_table(index = ['Prov', 'Year', 'Type'], values = 'EnergyUse', aggfunc = 'sum').reset_index()\
.assign(LogEnergyUse = lambda _df : _df.EnergyUse.apply(np.log))
시각화
fig = ggplot(tidydata)
line = geom_line(aes(x = 'Year', y = 'LogEnergyUse', color = 'Type', linetype = 'Type'))

fig + line + facet_wrap('Prov', scales = 'free')  ## 해당 옵션은 그래프마다 스케일을 따로 적용시킨다.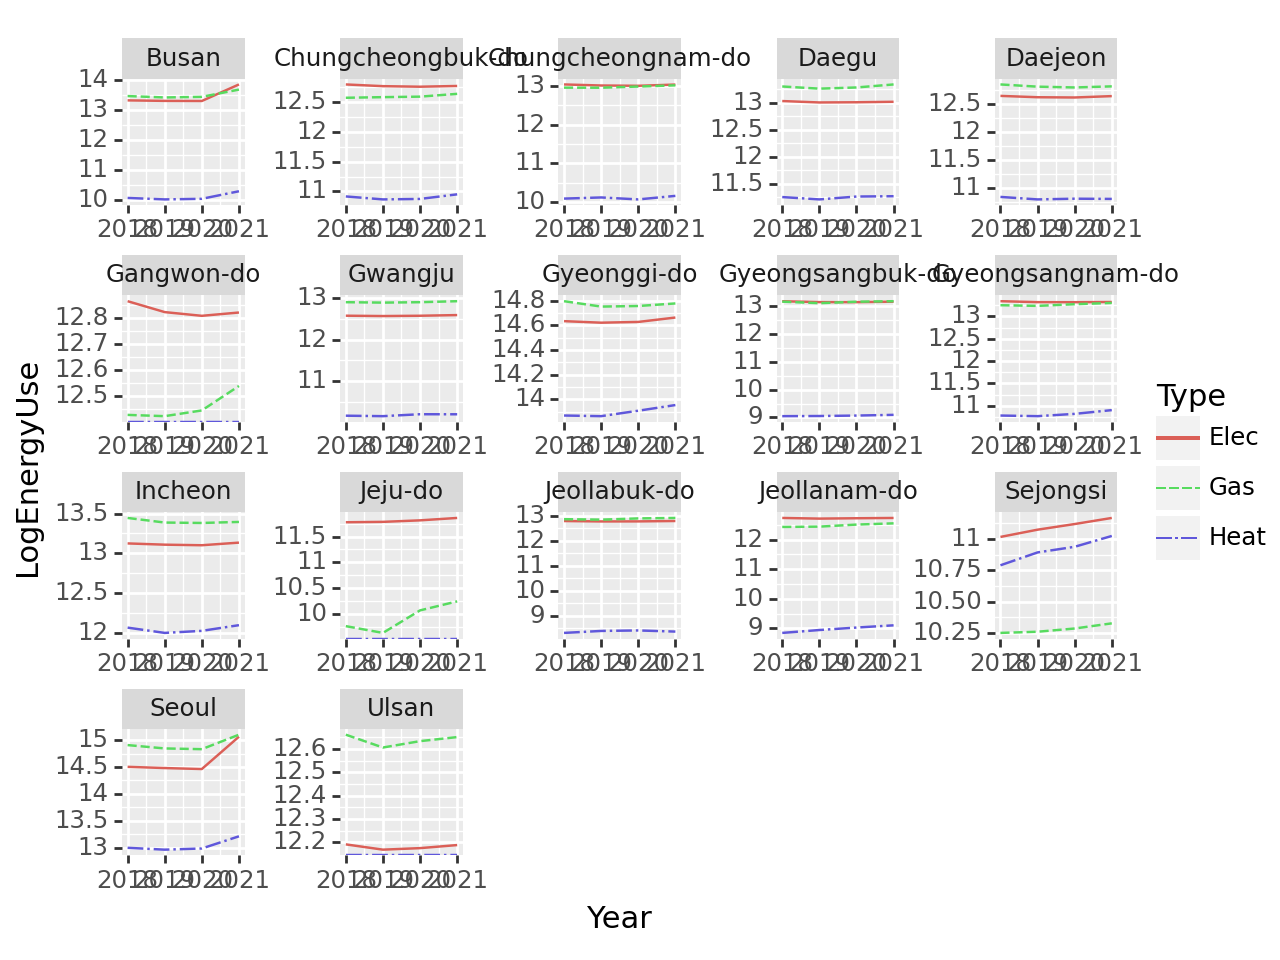
뭔가 시각화는 되었는데, 마음에 들지 않는다.
## matplotlib로 해당 개체를 이전
fig = (fig + line + facet_wrap('Prov', scales = 'free')).draw()
fig
fig.set_size_inches(10, 6)
fig.set_dpi(150)
fig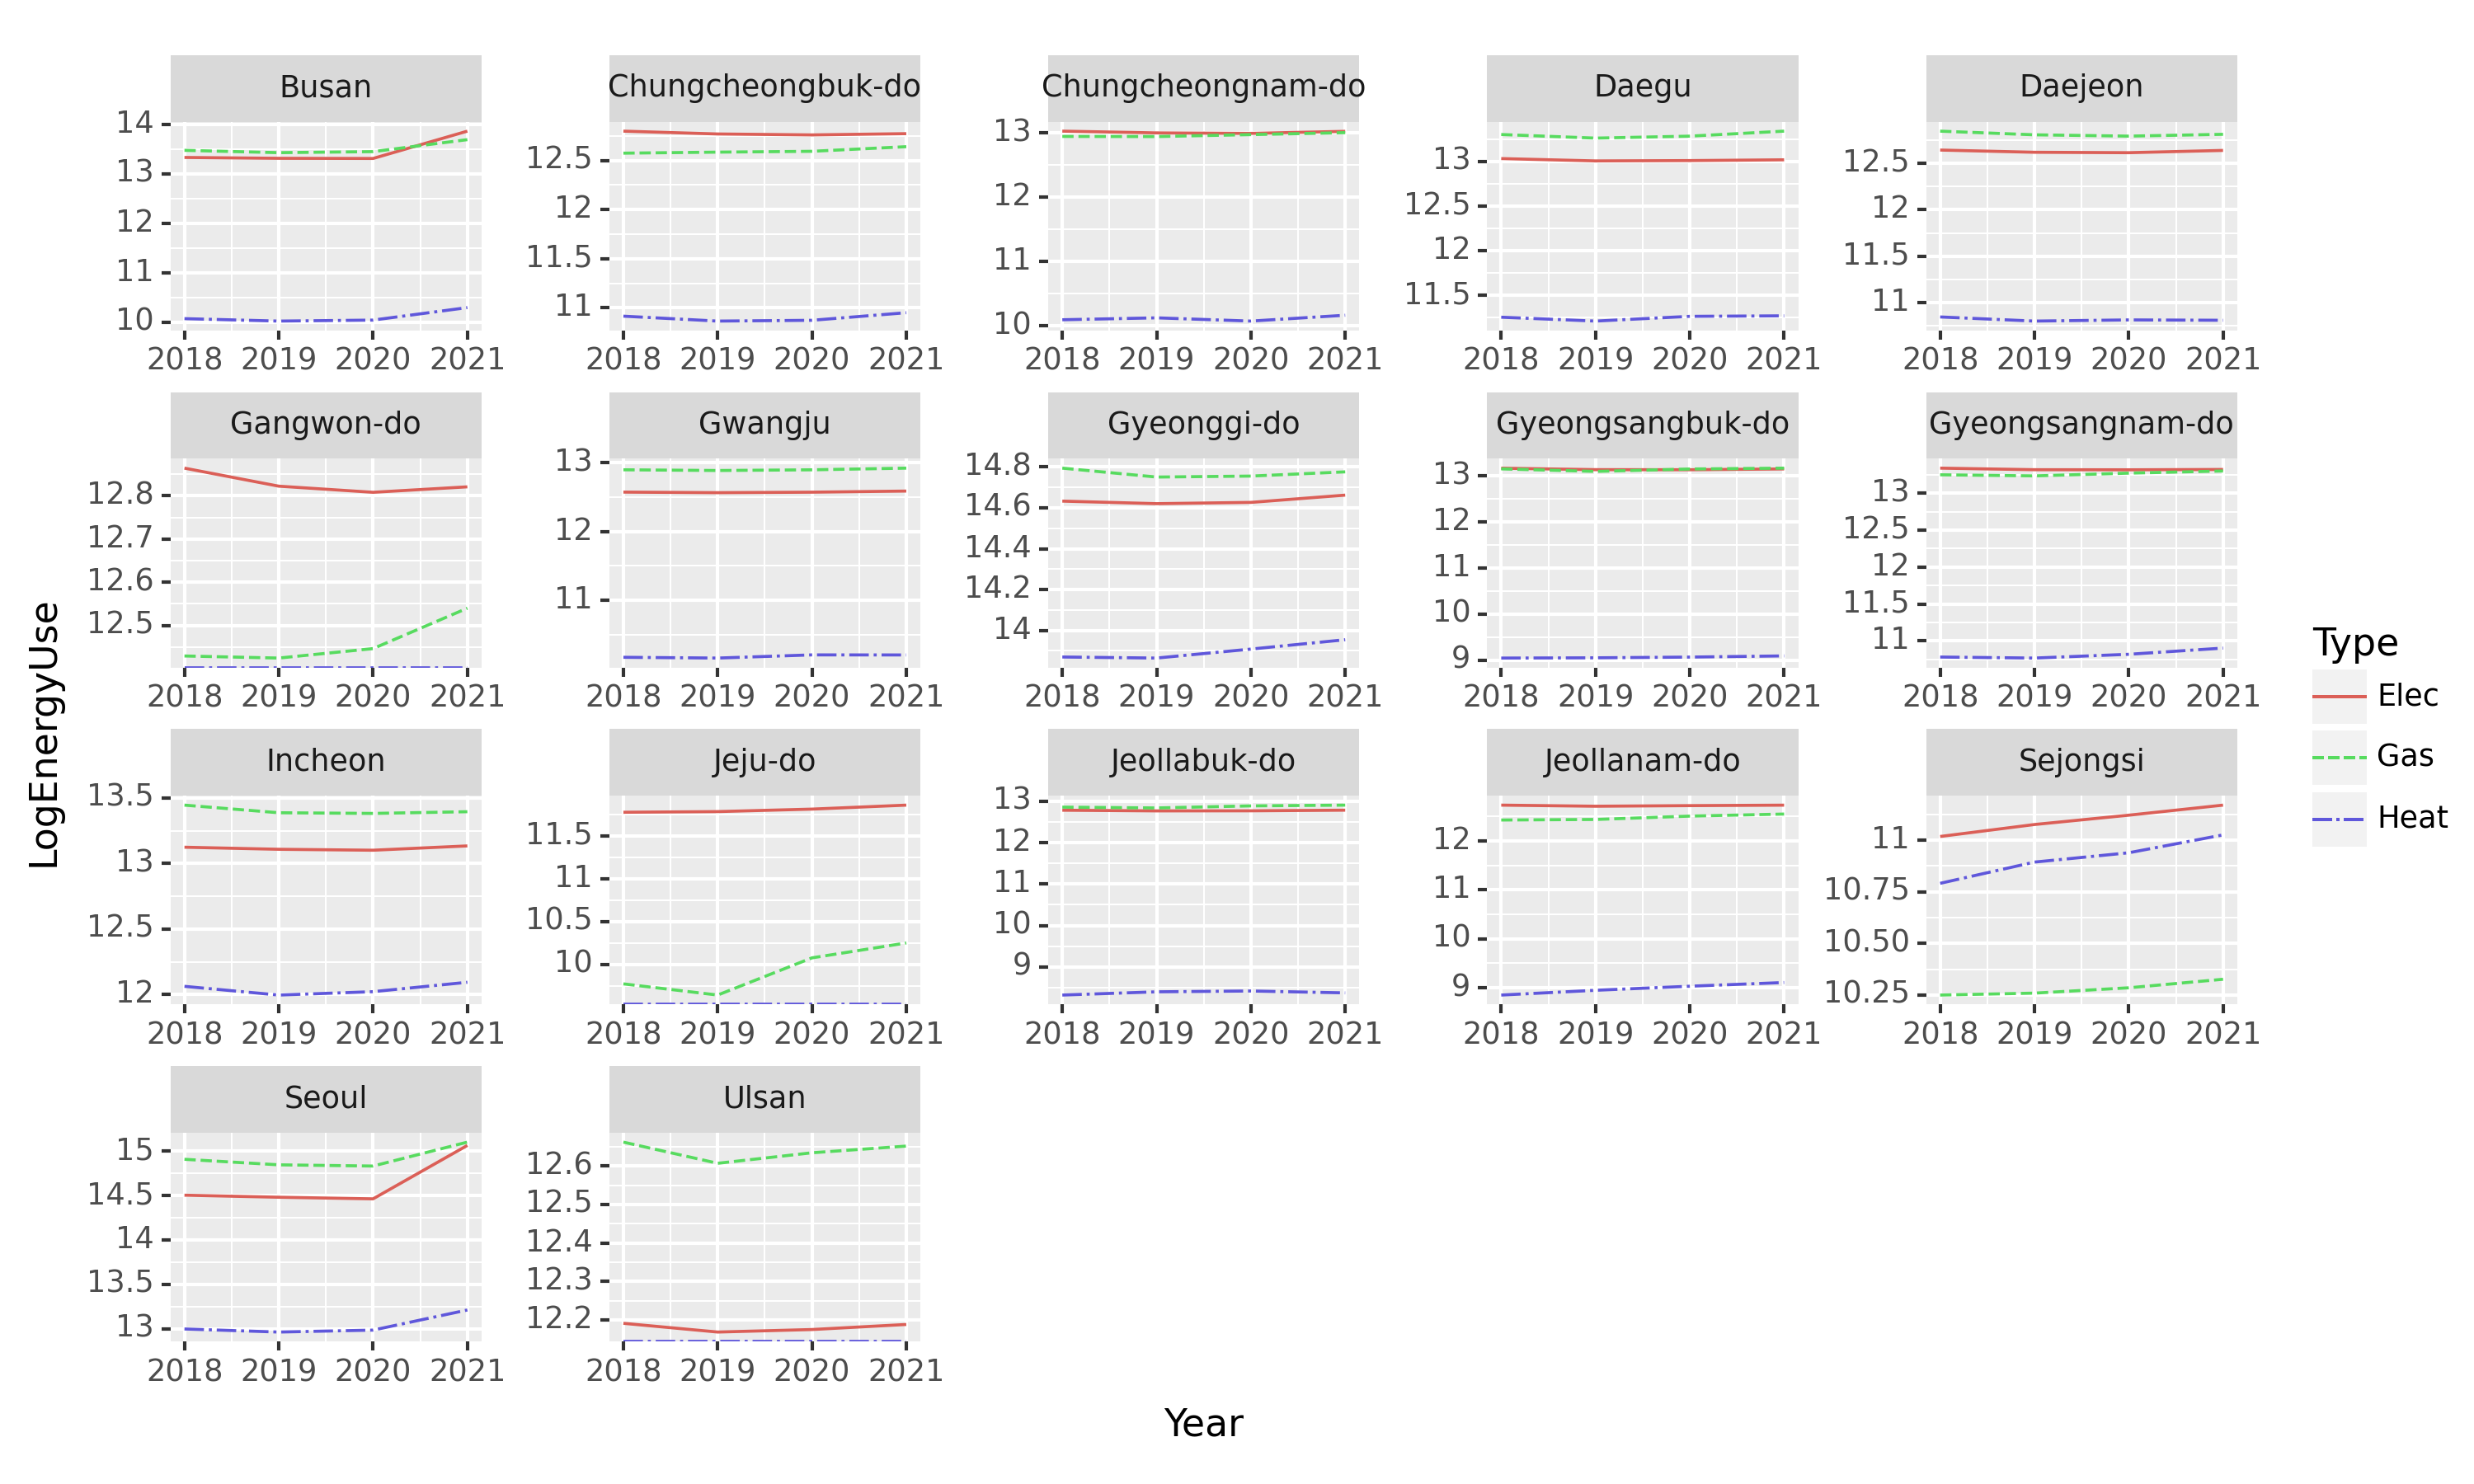
matplotlib에서의 메소드를 쉽게 적용시킬 수 있다.
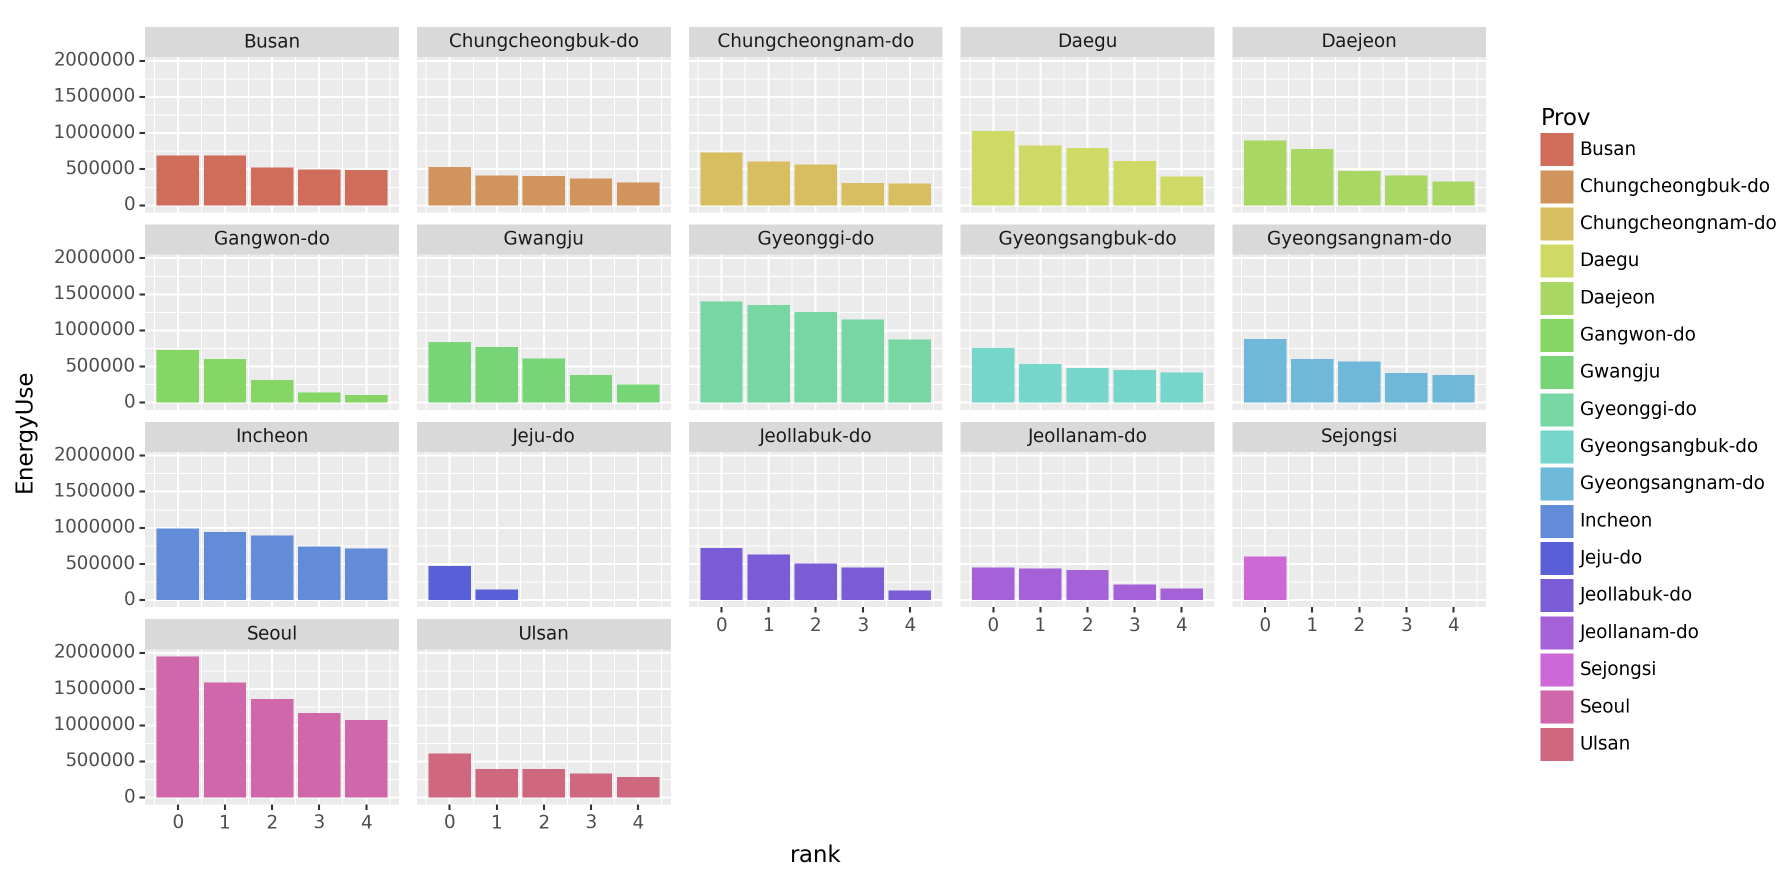
- Prov별로 총 에너지사용량이 많은 상위5개의 Reg을 찾고 아래와 같이 시각화 하라.
df.set_index(['지역', '년도', '시도']).applymap(lambda x : str(x).replace(',','')).astype(int).reset_index()\
.rename(name_dict, axis = 1)| Reg | Year | Prov | BldgCount | Area | Elec | Gas | Heat | |
|---|---|---|---|---|---|---|---|---|
| 0 | 종로구 | 2018 | Seoul | 17929 | 9141777 | 64818 | 82015 | 111 |
| 1 | 중구 | 2018 | Seoul | 10598 | 10056233 | 81672 | 75260 | 563 |
| 2 | 용산구 | 2018 | Seoul | 17201 | 10639652 | 52659 | 85220 | 12043 |
| 3 | 성동구 | 2018 | Seoul | 14180 | 11631770 | 60559 | 107416 | 0 |
| 4 | 광진구 | 2018 | Seoul | 21520 | 12054796 | 70609 | 130308 | 0 |
| ... | ... | ... | ... | ... | ... | ... | ... | ... |
| 995 | 함양군 | 2021 | Gyeongsangnam-do | 12505 | 1509149 | 6328 | 3164 | 0 |
| 996 | 거창군 | 2021 | Gyeongsangnam-do | 14607 | 2322093 | 10404 | 8850 | 0 |
| 997 | 합천군 | 2021 | Gyeongsangnam-do | 16039 | 1612734 | 7587 | 0 | 0 |
| 998 | 제주시 | 2021 | Jeju-do | 67053 | 20275738 | 103217 | 25689 | 0 |
| 999 | 서귀포시 | 2021 | Jeju-do | 35230 | 7512206 | 37884 | 2641 | 0 |
1000 rows × 8 columns
df.set_index(['지역', '년도', '시도']).applymap(lambda x : str(x).replace(',','')).astype(int).reset_index()\
.rename(name_dict, axis = 1)\
.drop(['Year', 'BldgCount', 'Area'], axis = 1)| Reg | Prov | Elec | Gas | Heat | |
|---|---|---|---|---|---|
| 0 | 종로구 | Seoul | 64818 | 82015 | 111 |
| 1 | 중구 | Seoul | 81672 | 75260 | 563 |
| 2 | 용산구 | Seoul | 52659 | 85220 | 12043 |
| 3 | 성동구 | Seoul | 60559 | 107416 | 0 |
| 4 | 광진구 | Seoul | 70609 | 130308 | 0 |
| ... | ... | ... | ... | ... | ... |
| 995 | 함양군 | Gyeongsangnam-do | 6328 | 3164 | 0 |
| 996 | 거창군 | Gyeongsangnam-do | 10404 | 8850 | 0 |
| 997 | 합천군 | Gyeongsangnam-do | 7587 | 0 | 0 |
| 998 | 제주시 | Jeju-do | 103217 | 25689 | 0 |
| 999 | 서귀포시 | Jeju-do | 37884 | 2641 | 0 |
1000 rows × 5 columns
필요없는 열을 없앤다.
df.set_index(['지역', '년도', '시도']).applymap(lambda x : str(x).replace(',','')).astype(int).reset_index()\
.rename(name_dict, axis = 1)\
.drop(['Year', 'BldgCount', 'Area'], axis = 1)\
.set_index(['Prov', 'Reg']).stack().reset_index().rename({'level_2' : 'Type', 0 : 'EnergyUse'}, axis = 1)| Prov | Reg | Type | EnergyUse | |
|---|---|---|---|---|
| 0 | Seoul | 종로구 | Elec | 64818 |
| 1 | Seoul | 종로구 | Gas | 82015 |
| 2 | Seoul | 종로구 | Heat | 111 |
| 3 | Seoul | 중구 | Elec | 81672 |
| 4 | Seoul | 중구 | Gas | 75260 |
| ... | ... | ... | ... | ... |
| 2995 | Jeju-do | 제주시 | Gas | 25689 |
| 2996 | Jeju-do | 제주시 | Heat | 0 |
| 2997 | Jeju-do | 서귀포시 | Elec | 37884 |
| 2998 | Jeju-do | 서귀포시 | Gas | 2641 |
| 2999 | Jeju-do | 서귀포시 | Heat | 0 |
3000 rows × 4 columns
지역과 구, 타입과 에너지를 표기했다. 이름도 적절히 설정해줬다.
df.set_index(['지역', '년도', '시도']).applymap(lambda x : str(x).replace(',','')).astype(int).reset_index()\
.rename(name_dict, axis = 1)\
.drop(['Year', 'BldgCount', 'Area'], axis = 1)\
.set_index(['Prov', 'Reg']).stack().reset_index().rename({'level_2' : 'Type', 0 : 'EnergyUse'}, axis = 1)\
.pivot_table(index = ['Prov', 'Reg'], values = 'EnergyUse', aggfunc = 'sum').reset_index()| Prov | Reg | EnergyUse | |
|---|---|---|---|
| 0 | Busan | 강서구 | 200386 |
| 1 | Busan | 금정구 | 451212 |
| 2 | Busan | 기장군 | 287926 |
| 3 | Busan | 남구 | 491030 |
| 4 | Busan | 동구 | 156302 |
| ... | ... | ... | ... |
| 245 | Ulsan | 남구 | 607820 |
| 246 | Ulsan | 동구 | 281094 |
| 247 | Ulsan | 북구 | 334844 |
| 248 | Ulsan | 울주군 | 394217 |
| 249 | Ulsan | 중구 | 395158 |
250 rows × 3 columns
구역별로 에너지 사용량을 합쳐버렸다.
g = df.set_index(['지역', '년도', '시도']).applymap(lambda x : str(x).replace(',','')).astype(int).reset_index()\
.rename(name_dict, axis = 1)\
.drop(['Year', 'BldgCount', 'Area'], axis = 1)\
.set_index(['Prov', 'Reg']).stack().reset_index().rename({'level_2' : 'Type', 0 : 'EnergyUse'}, axis = 1)\
.pivot_table(index = ['Prov', 'Reg'], values = 'EnergyUse', aggfunc = 'sum').reset_index()\
.groupby(by = 'Prov')

pd.concat([j.sort_values('EnergyUse', ascending = False).reset_index(drop = True).iloc[:5] for i, j in g], axis = 0)| Prov | Reg | EnergyUse | |
|---|---|---|---|
| 0 | Busan | 부산진구 | 690344 |
| 1 | Busan | 해운대구 | 689901 |
| 2 | Busan | 사하구 | 522150 |
| 3 | Busan | 북구 | 493913 |
| 4 | Busan | 남구 | 491030 |
| ... | ... | ... | ... |
| 0 | Ulsan | 남구 | 607820 |
| 1 | Ulsan | 중구 | 395158 |
| 2 | Ulsan | 울주군 | 394217 |
| 3 | Ulsan | 북구 | 334844 |
| 4 | Ulsan | 동구 | 281094 |
78 rows × 3 columns
구간마다 순위를 정해주기 위해 groupby 함수를 사용, sub-dataframe으로 쪼갠 후에 각각 sort_values() 해주었다.
pd.concat([j.sort_values('EnergyUse', ascending = False).reset_index(drop = True).iloc[:5] for i, j in g], axis = 0)\
.reset_index().rename({'index' : 'rank'}, axis = 1)| rank | Prov | Reg | EnergyUse | |
|---|---|---|---|---|
| 0 | 0 | Busan | 부산진구 | 690344 |
| 1 | 1 | Busan | 해운대구 | 689901 |
| 2 | 2 | Busan | 사하구 | 522150 |
| 3 | 3 | Busan | 북구 | 493913 |
| 4 | 4 | Busan | 남구 | 491030 |
| ... | ... | ... | ... | ... |
| 73 | 0 | Ulsan | 남구 | 607820 |
| 74 | 1 | Ulsan | 중구 | 395158 |
| 75 | 2 | Ulsan | 울주군 | 394217 |
| 76 | 3 | Ulsan | 북구 | 334844 |
| 77 | 4 | Ulsan | 동구 | 281094 |
78 rows × 4 columns
인덱스는 랭크와 동일하므로 따로 남겨둔다.
tidydata = pd.concat([j.sort_values('EnergyUse', ascending = False).reset_index(drop = True).iloc[:5] for i, j in g], axis = 0)\
.reset_index().rename({'index' : 'rank'}, axis = 1)

fig = ggplot(tidydata)
bar = geom_col(aes(x = 'rank', y = 'EnergyUse', fill = 'Prov'))

fig + bar + facet_wrap('Prov')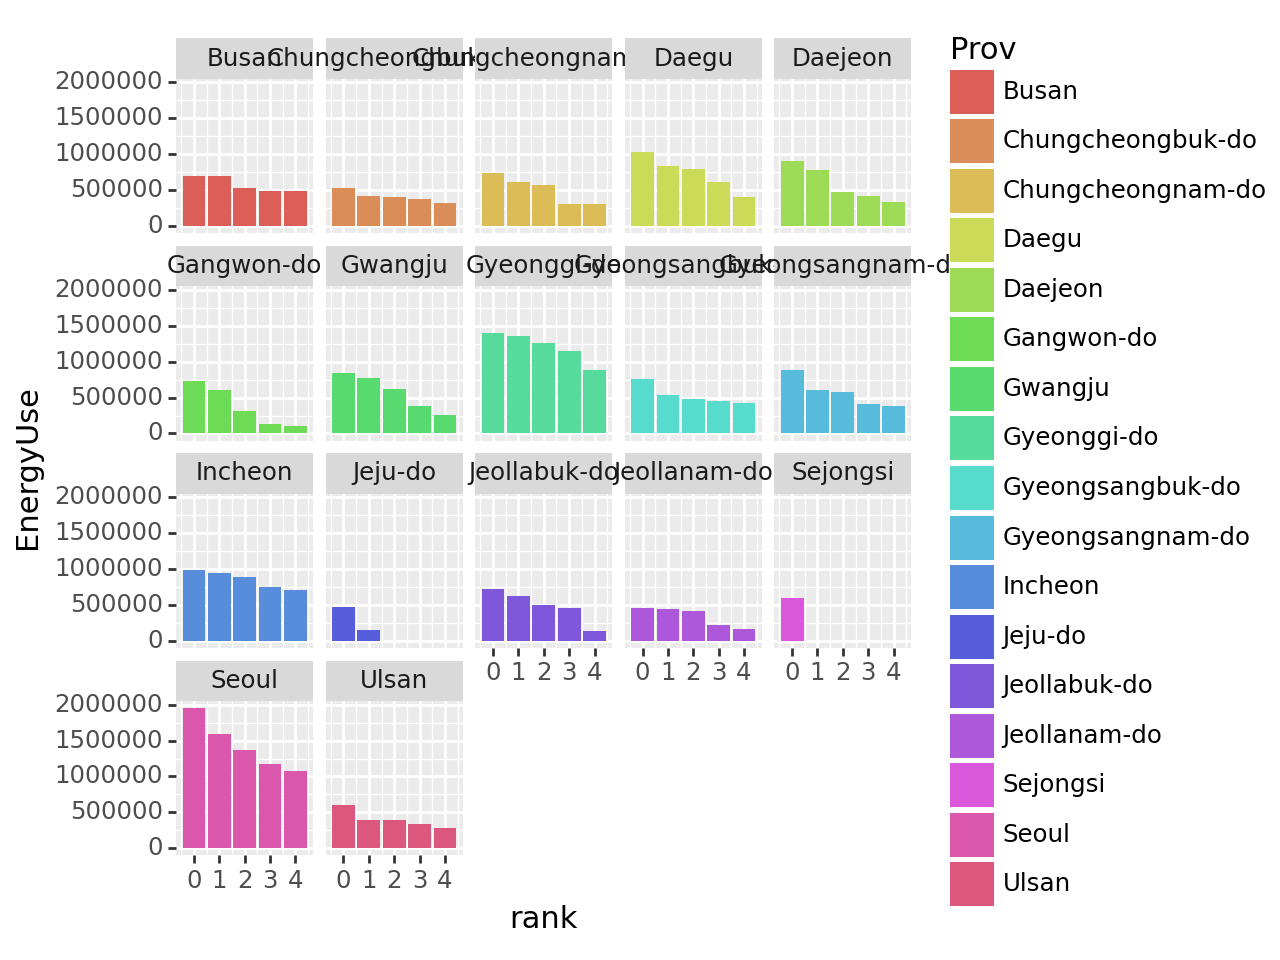
정보는 모두 포함하나, 짜임새가 없으므로 matplotlib로 이전
fig = (fig + bar + facet_wrap('Prov')).draw()fig.set_size_inches(12, 6)
fig.set_dpi(150)
fig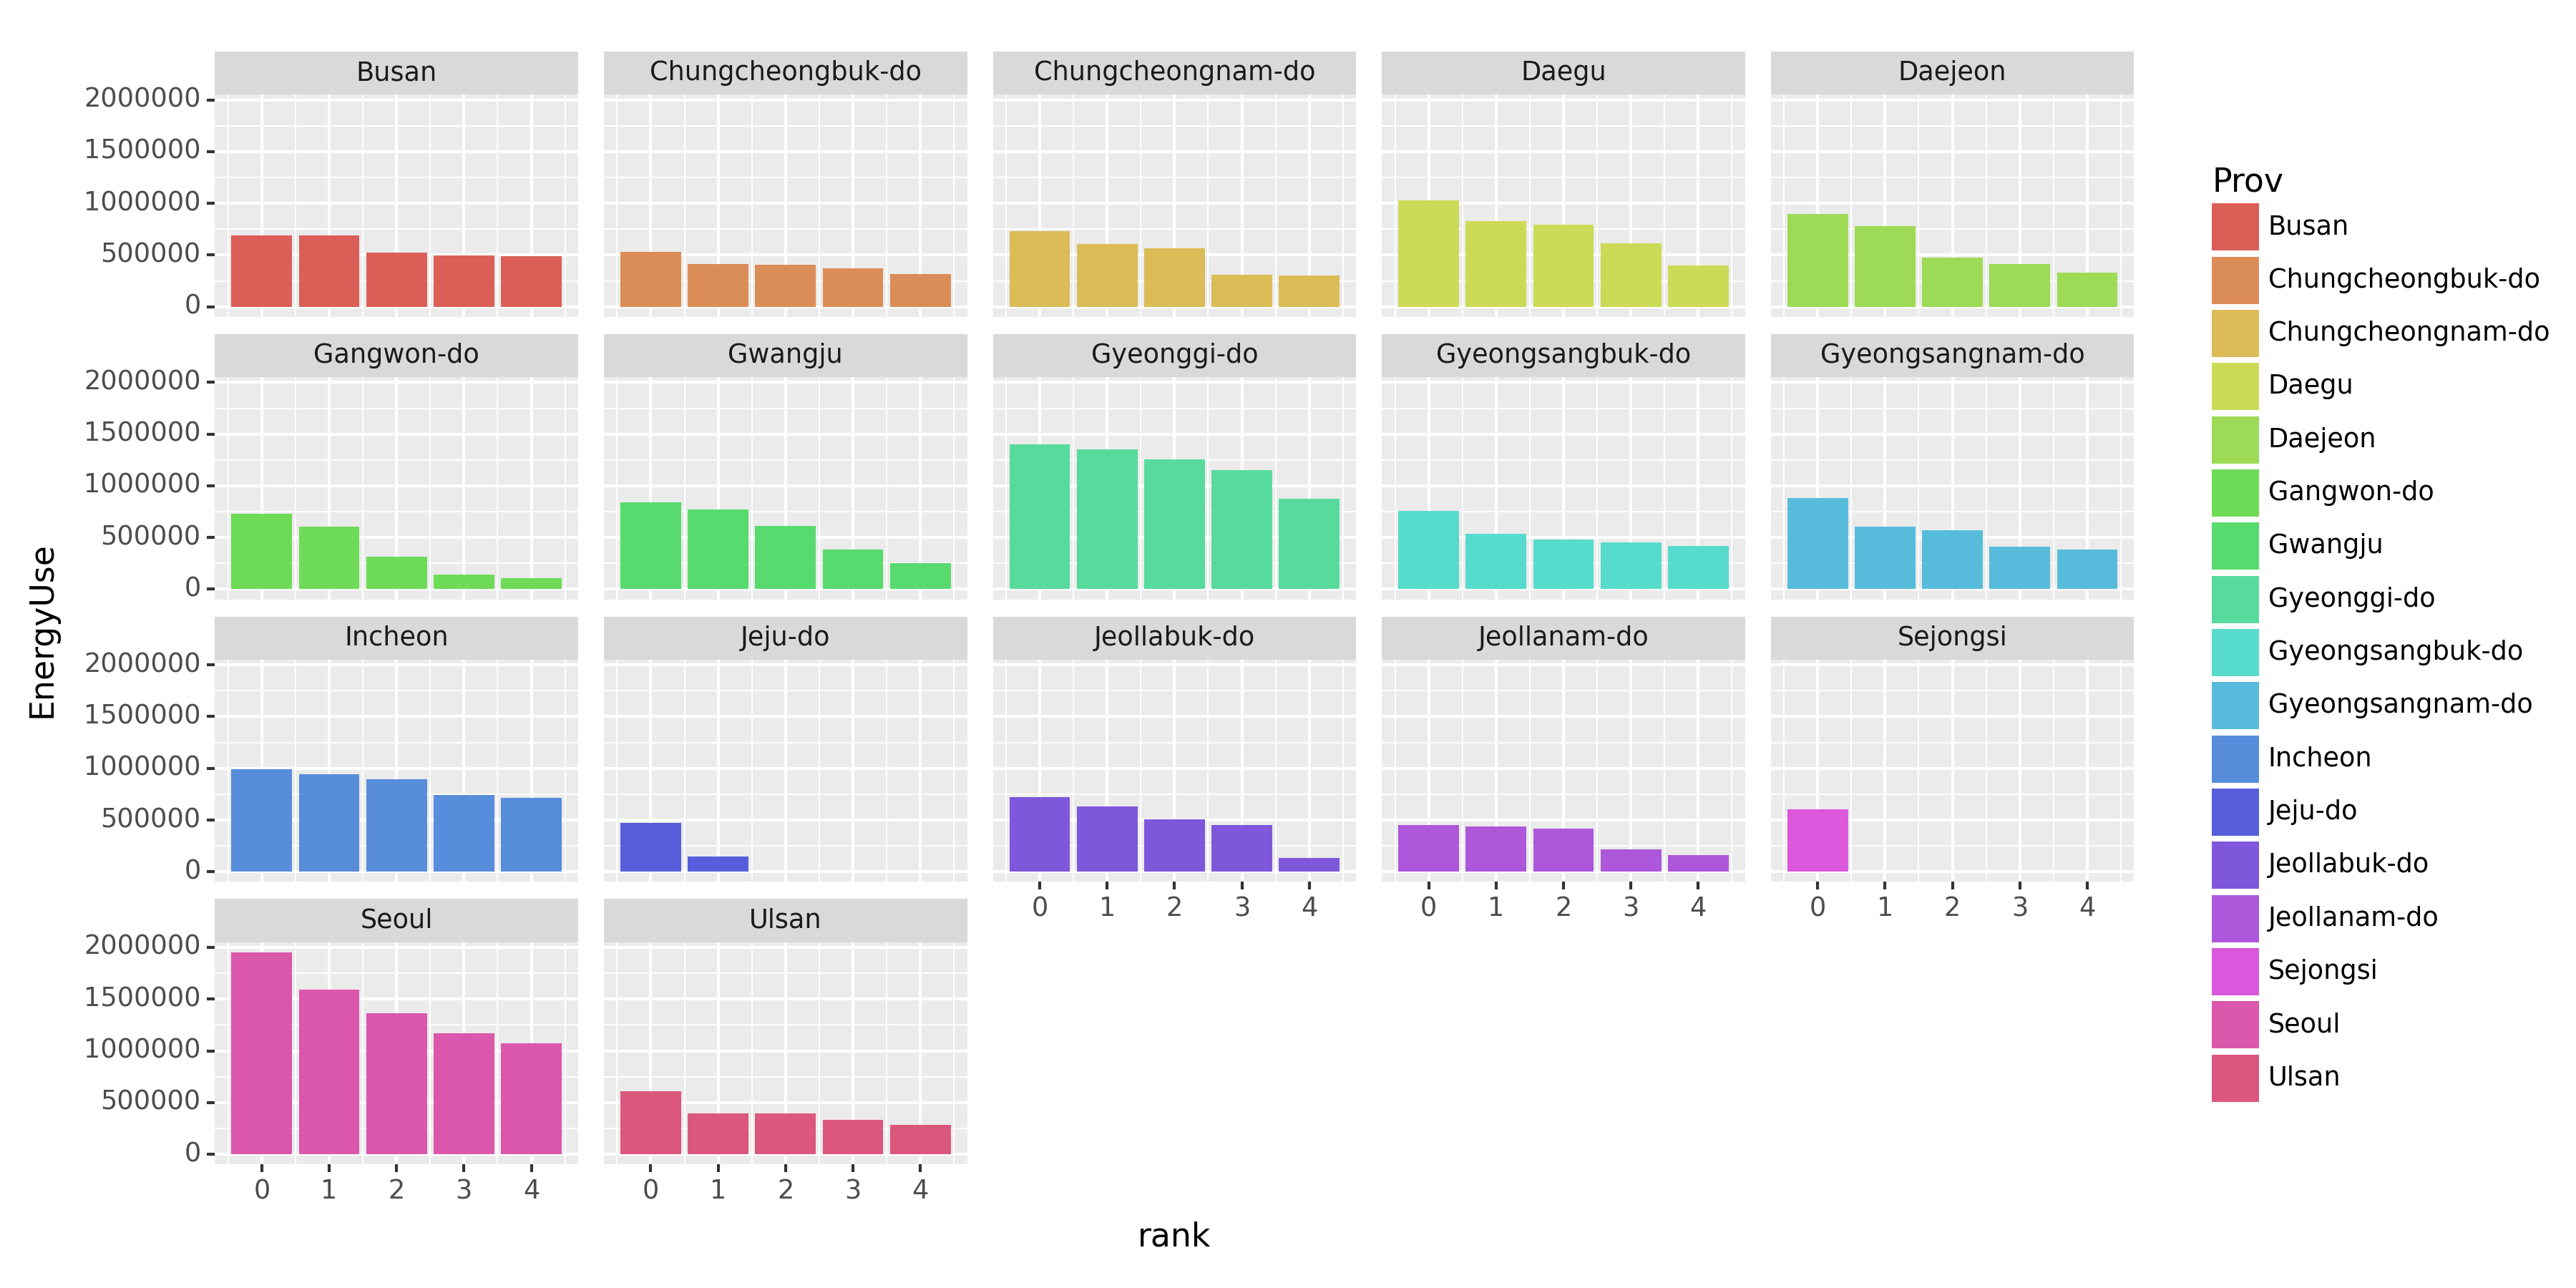
완료
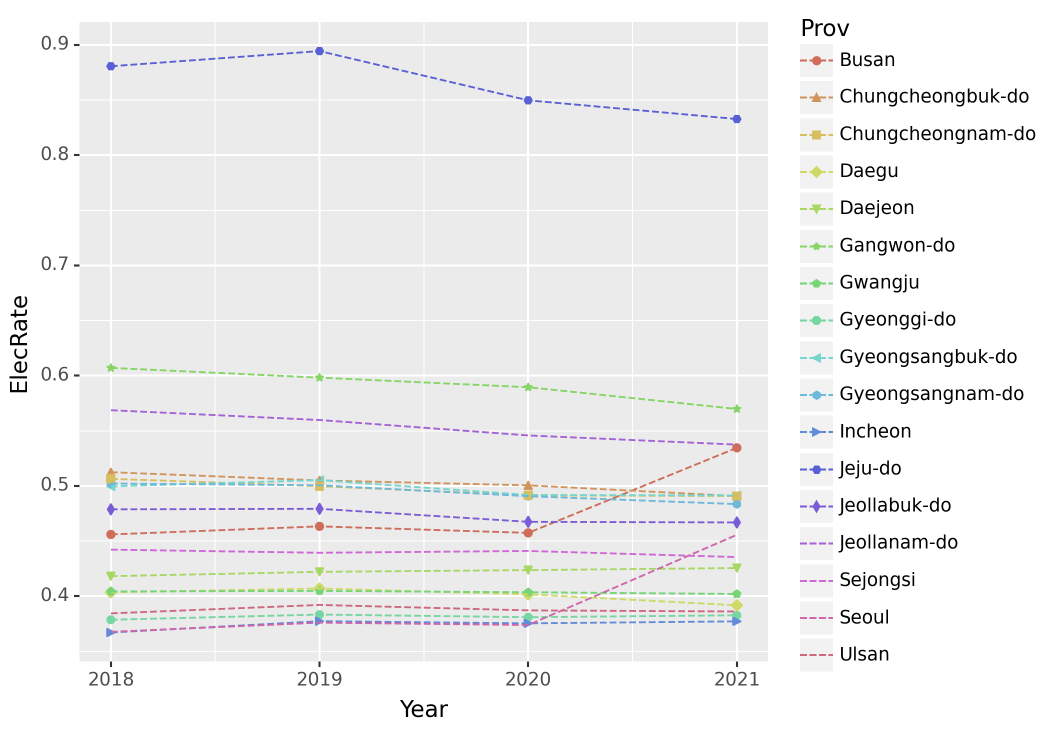
- (Prov,Year)별 전기에너지 사용량 비율을 구하고 아래와 같이 시각화 하라. + 제주를 제외한 지역으로 한정하고 시각화하라.
df.set_index(['지역', '년도', '시도']).applymap(lambda x : str(x).replace(',','')).astype(int).reset_index()\
.rename(name_dict, axis = 1)| Reg | Year | Prov | BldgCount | Area | Elec | Gas | Heat | |
|---|---|---|---|---|---|---|---|---|
| 0 | 종로구 | 2018 | Seoul | 17929 | 9141777 | 64818 | 82015 | 111 |
| 1 | 중구 | 2018 | Seoul | 10598 | 10056233 | 81672 | 75260 | 563 |
| 2 | 용산구 | 2018 | Seoul | 17201 | 10639652 | 52659 | 85220 | 12043 |
| 3 | 성동구 | 2018 | Seoul | 14180 | 11631770 | 60559 | 107416 | 0 |
| 4 | 광진구 | 2018 | Seoul | 21520 | 12054796 | 70609 | 130308 | 0 |
| ... | ... | ... | ... | ... | ... | ... | ... | ... |
| 995 | 함양군 | 2021 | Gyeongsangnam-do | 12505 | 1509149 | 6328 | 3164 | 0 |
| 996 | 거창군 | 2021 | Gyeongsangnam-do | 14607 | 2322093 | 10404 | 8850 | 0 |
| 997 | 합천군 | 2021 | Gyeongsangnam-do | 16039 | 1612734 | 7587 | 0 | 0 |
| 998 | 제주시 | 2021 | Jeju-do | 67053 | 20275738 | 103217 | 25689 | 0 |
| 999 | 서귀포시 | 2021 | Jeju-do | 35230 | 7512206 | 37884 | 2641 | 0 |
1000 rows × 8 columns
사용해야 할 것
x = ‘Year’, y = ‘ElecRate’, facet_wrap(’Prov”)
Elec, Gas, Heat
df.set_index(['지역', '년도', '시도']).applymap(lambda x : str(x).replace(',','')).astype(int).reset_index()\
.rename(name_dict, axis = 1)\
.drop(['Reg', 'BldgCount', 'Area'], axis = 1)| Year | Prov | Elec | Gas | Heat | |
|---|---|---|---|---|---|
| 0 | 2018 | Seoul | 64818 | 82015 | 111 |
| 1 | 2018 | Seoul | 81672 | 75260 | 563 |
| 2 | 2018 | Seoul | 52659 | 85220 | 12043 |
| 3 | 2018 | Seoul | 60559 | 107416 | 0 |
| 4 | 2018 | Seoul | 70609 | 130308 | 0 |
| ... | ... | ... | ... | ... | ... |
| 995 | 2021 | Gyeongsangnam-do | 6328 | 3164 | 0 |
| 996 | 2021 | Gyeongsangnam-do | 10404 | 8850 | 0 |
| 997 | 2021 | Gyeongsangnam-do | 7587 | 0 | 0 |
| 998 | 2021 | Jeju-do | 103217 | 25689 | 0 |
| 999 | 2021 | Jeju-do | 37884 | 2641 | 0 |
1000 rows × 5 columns
필요없는 걸 없애고…
df.set_index(['지역', '년도', '시도']).applymap(lambda x : str(x).replace(',','')).astype(int).reset_index()\
.rename(name_dict, axis = 1)\
.drop(['Reg', 'BldgCount', 'Area'], axis = 1)\
.set_index(['Year', 'Prov']).stack().reset_index().rename({'level_2' : 'Type', 0 : 'EnergyUse'}, axis = 1)| Year | Prov | Type | EnergyUse | |
|---|---|---|---|---|
| 0 | 2018 | Seoul | Elec | 64818 |
| 1 | 2018 | Seoul | Gas | 82015 |
| 2 | 2018 | Seoul | Heat | 111 |
| 3 | 2018 | Seoul | Elec | 81672 |
| 4 | 2018 | Seoul | Gas | 75260 |
| ... | ... | ... | ... | ... |
| 2995 | 2021 | Jeju-do | Gas | 25689 |
| 2996 | 2021 | Jeju-do | Heat | 0 |
| 2997 | 2021 | Jeju-do | Elec | 37884 |
| 2998 | 2021 | Jeju-do | Gas | 2641 |
| 2999 | 2021 | Jeju-do | Heat | 0 |
3000 rows × 4 columns
long data로 변환했다.
df.set_index(['지역', '년도', '시도']).applymap(lambda x : str(x).replace(',','')).astype(int).reset_index()\
.rename(name_dict, axis = 1)\
.drop(['Reg', 'BldgCount', 'Area'], axis = 1)\
.set_index(['Year', 'Prov']).stack().reset_index().rename({'level_2' : 'Type', 0 : 'EnergyUse'}, axis = 1)\
.pivot_table(index = ['Year', 'Prov'], columns = 'Type', values = 'EnergyUse', aggfunc = 'sum')| Type | Elec | Gas | Heat | |
|---|---|---|---|---|
| Year | Prov | |||
| 2018 | Busan | 613522 | 708240 | 23694 |
| Chungcheongbuk-do | 361490 | 288927 | 55002 | |
| Chungcheongnam-do | 456260 | 420315 | 24286 | |
| Daegu | 457556 | 599115 | 77399 | |
| Daejeon | 309660 | 379571 | 51341 | |
| ... | ... | ... | ... | ... |
| 2021 | Jeollabuk-do | 357058 | 403399 | 4321 |
| Jeollanam-do | 338032 | 281895 | 9012 | |
| Sejongsi | 70915 | 30533 | 61404 | |
| Seoul | 3486022 | 3617731 | 546491 | |
| Ulsan | 196412 | 312276 | 0 |
68 rows × 3 columns
지역(Prov)과 연도(Year)가 중복되는 값들을 각각 더해줘서 정리했다.
df.set_index(['지역', '년도', '시도']).applymap(lambda x : str(x).replace(',','')).astype(int).reset_index()\
.rename(name_dict, axis = 1)\
.drop(['Reg', 'BldgCount', 'Area'], axis = 1)\
.set_index(['Year', 'Prov']).stack().reset_index().rename({'level_2' : 'Type', 0 : 'EnergyUse'}, axis = 1)\
.pivot_table(index = ['Year', 'Prov'], columns = 'Type', values = 'EnergyUse', aggfunc = 'sum')\
.assign(EnergyUse = lambda _df : _df.Elec + _df.Gas + _df.Heat)| Type | Elec | Gas | Heat | EnergyUse | |
|---|---|---|---|---|---|
| Year | Prov | ||||
| 2018 | Busan | 613522 | 708240 | 23694 | 1345456 |
| Chungcheongbuk-do | 361490 | 288927 | 55002 | 705419 | |
| Chungcheongnam-do | 456260 | 420315 | 24286 | 900861 | |
| Daegu | 457556 | 599115 | 77399 | 1134070 | |
| Daejeon | 309660 | 379571 | 51341 | 740572 | |
| ... | ... | ... | ... | ... | ... |
| 2021 | Jeollabuk-do | 357058 | 403399 | 4321 | 764778 |
| Jeollanam-do | 338032 | 281895 | 9012 | 628939 | |
| Sejongsi | 70915 | 30533 | 61404 | 162852 | |
| Seoul | 3486022 | 3617731 | 546491 | 7650244 | |
| Ulsan | 196412 | 312276 | 0 | 508688 |
68 rows × 4 columns
총 에너지 사용량 중 전기 에너지만을 구해야 하니 먼저 총 에너지를 구해준다.
df.set_index(['지역', '년도', '시도']).applymap(lambda x : str(x).replace(',','')).astype(int).reset_index()\
.rename(name_dict, axis = 1)\
.drop(['Reg', 'BldgCount', 'Area'], axis = 1)\
.set_index(['Year', 'Prov']).stack().reset_index().rename({'level_2' : 'Type', 0 : 'EnergyUse'}, axis = 1)\
.pivot_table(index = ['Year', 'Prov'], columns = 'Type', values = 'EnergyUse', aggfunc = 'sum')\
.assign(EnergyUse = lambda _df : _df.Elec + _df.Gas + _df.Heat)\
.drop(['Gas', 'Heat'], axis = 1).assign(ElecRate = lambda _df : _df.Elec / _df.EnergyUse)| Type | Elec | EnergyUse | ElecRate | |
|---|---|---|---|---|
| Year | Prov | |||
| 2018 | Busan | 613522 | 1345456 | 0.455996 |
| Chungcheongbuk-do | 361490 | 705419 | 0.512447 | |
| Chungcheongnam-do | 456260 | 900861 | 0.506471 | |
| Daegu | 457556 | 1134070 | 0.403464 | |
| Daejeon | 309660 | 740572 | 0.418136 | |
| ... | ... | ... | ... | ... |
| 2021 | Jeollabuk-do | 357058 | 764778 | 0.466878 |
| Jeollanam-do | 338032 | 628939 | 0.537464 | |
| Sejongsi | 70915 | 162852 | 0.435457 | |
| Seoul | 3486022 | 7650244 | 0.455675 | |
| Ulsan | 196412 | 508688 | 0.386115 |
68 rows × 3 columns
필요없는 것을 없애고 비율을 넣어줬다. 이제 필요한 것은 비율 뿐이다.
df.set_index(['지역', '년도', '시도']).applymap(lambda x : str(x).replace(',','')).astype(int).reset_index()\
.rename(name_dict, axis = 1)\
.drop(['Reg', 'BldgCount', 'Area'], axis = 1)\
.set_index(['Year', 'Prov']).stack().reset_index().rename({'level_2' : 'Type', 0 : 'EnergyUse'}, axis = 1)\
.pivot_table(index = ['Year', 'Prov'], columns = 'Type', values = 'EnergyUse', aggfunc = 'sum')\
.assign(EnergyUse = lambda _df : _df.Elec + _df.Gas + _df.Heat)\
.drop(['Gas', 'Heat'], axis = 1).assign(ElecRate = lambda _df : _df.Elec / _df.EnergyUse)\
.drop(['Elec', 'EnergyUse'], axis = 1).reset_index()| Type | Year | Prov | ElecRate |
|---|---|---|---|
| 0 | 2018 | Busan | 0.455996 |
| 1 | 2018 | Chungcheongbuk-do | 0.512447 |
| 2 | 2018 | Chungcheongnam-do | 0.506471 |
| 3 | 2018 | Daegu | 0.403464 |
| 4 | 2018 | Daejeon | 0.418136 |
| ... | ... | ... | ... |
| 63 | 2021 | Jeollabuk-do | 0.466878 |
| 64 | 2021 | Jeollanam-do | 0.537464 |
| 65 | 2021 | Sejongsi | 0.435457 |
| 66 | 2021 | Seoul | 0.455675 |
| 67 | 2021 | Ulsan | 0.386115 |
68 rows × 3 columns
타이디데이터 같다.
tidydata = df.set_index(['지역', '년도', '시도']).applymap(lambda x : str(x).replace(',','')).astype(int).reset_index()\
.rename(name_dict, axis = 1)\
.drop(['Reg', 'BldgCount', 'Area'], axis = 1)\
.set_index(['Year', 'Prov']).stack().reset_index().rename({'level_2' : 'Type', 0 : 'EnergyUse'}, axis = 1)\
.pivot_table(index = ['Year', 'Prov'], columns = 'Type', values = 'EnergyUse', aggfunc = 'sum')\
.assign(EnergyUse = lambda _df : _df.Elec + _df.Gas + _df.Heat)\
.drop(['Gas', 'Heat'], axis = 1).assign(ElecRate = lambda _df : _df.Elec / _df.EnergyUse)\
.drop(['Elec', 'EnergyUse'], axis = 1).reset_index()
fig = ggplot(tidydata)
line = geom_line(aes(x = 'Year', y = 'ElecRate', color = 'Prov'), linetype = 'dashed')
point = geom_point(aes(x = 'Year', y = 'ElecRate', color = 'Prov', shape = 'Prov'))
fig + line + pointC:\Users\hollyriver\anaconda3\envs\py\lib\site-packages\mizani\palettes.py:706: UserWarning: Palette can return a maximum of 13 values. 17 values requested.
C:\Users\hollyriver\anaconda3\envs\py\lib\site-packages\plotnine\layer.py:364: PlotnineWarning: geom_point : Removed 16 rows containing missing values.
C:\Users\hollyriver\anaconda3\envs\py\lib\site-packages\mizani\palettes.py:706: UserWarning: Palette can return a maximum of 13 values. 17 values requested.
C:\Users\hollyriver\anaconda3\envs\py\lib\site-packages\plotnine\guides\guides.py:259: PlotnineWarning: geom_point legend : Removed 4 rows containing missing values.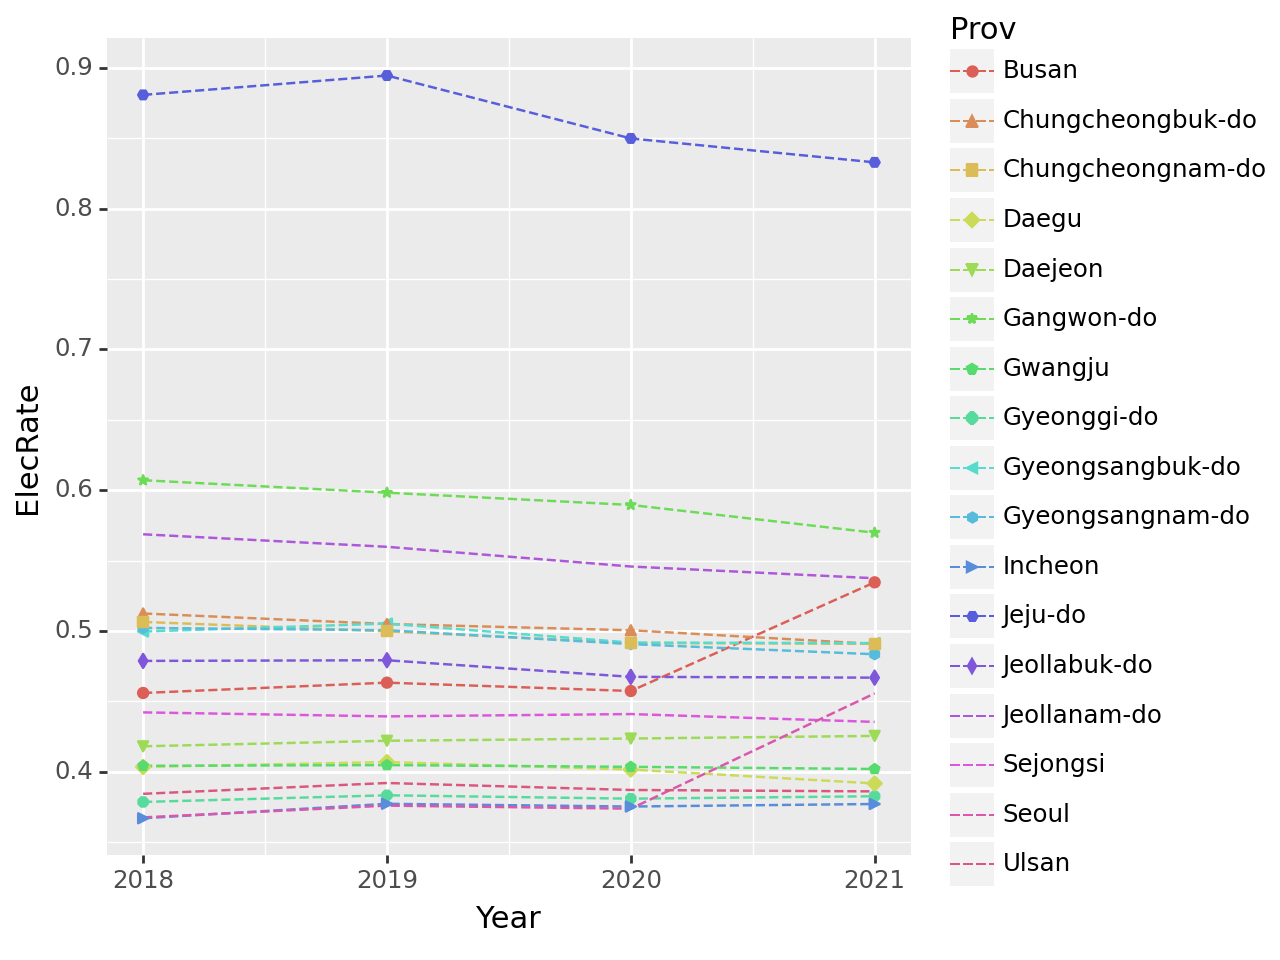
나름 괜찮지만 그래도 matplotlib에 데려와보자.
fig_ = (fig + line + point).draw()
fig_.set_dpi(150)
fig_
C:\Users\hollyriver\anaconda3\envs\py\lib\site-packages\mizani\palettes.py:706: UserWarning: Palette can return a maximum of 13 values. 17 values requested.
C:\Users\hollyriver\anaconda3\envs\py\lib\site-packages\plotnine\layer.py:364: PlotnineWarning: geom_point : Removed 16 rows containing missing values.
C:\Users\hollyriver\anaconda3\envs\py\lib\site-packages\mizani\palettes.py:706: UserWarning: Palette can return a maximum of 13 values. 17 values requested.
C:\Users\hollyriver\anaconda3\envs\py\lib\site-packages\plotnine\guides\guides.py:259: PlotnineWarning: geom_point legend : Removed 4 rows containing missing values.
~와 나 너무 잘하는 거 아님?~
4. pd.merge()의 이용
그냥 뇌정지 올 것 같아도 일단 tidydata로 변환하고 시작하자!!
df.set_index(['지역', '년도', '시도']).applymap(lambda x : str(x).replace(',','')).astype(int).reset_index()\
.rename(name_dict, axis = 1).drop(['BldgCount', 'Area'], axis = 1)| Reg | Year | Prov | Elec | Gas | Heat | |
|---|---|---|---|---|---|---|
| 0 | 종로구 | 2018 | Seoul | 64818 | 82015 | 111 |
| 1 | 중구 | 2018 | Seoul | 81672 | 75260 | 563 |
| 2 | 용산구 | 2018 | Seoul | 52659 | 85220 | 12043 |
| 3 | 성동구 | 2018 | Seoul | 60559 | 107416 | 0 |
| 4 | 광진구 | 2018 | Seoul | 70609 | 130308 | 0 |
| ... | ... | ... | ... | ... | ... | ... |
| 995 | 함양군 | 2021 | Gyeongsangnam-do | 6328 | 3164 | 0 |
| 996 | 거창군 | 2021 | Gyeongsangnam-do | 10404 | 8850 | 0 |
| 997 | 합천군 | 2021 | Gyeongsangnam-do | 7587 | 0 | 0 |
| 998 | 제주시 | 2021 | Jeju-do | 103217 | 25689 | 0 |
| 999 | 서귀포시 | 2021 | Jeju-do | 37884 | 2641 | 0 |
1000 rows × 6 columns
이런 데이터가 있으면… 일단 value 세 개인 Elec, Gas, Heat를 녹여야 함.
df.set_index(['지역', '년도', '시도']).applymap(lambda x : str(x).replace(',','')).astype(int).reset_index()\
.rename(name_dict, axis = 1).drop(['BldgCount', 'Area'], axis = 1)\
.set_index(['Reg', 'Year', 'Prov']).stack().reset_index().rename({'level_3':'Type', 0:'EnergyUse'}, axis = 1)\
.pivot_table(index = ['Prov', 'Year'], values = 'EnergyUse', aggfunc = 'sum').reset_index()| Prov | Year | EnergyUse | |
|---|---|---|---|
| 0 | Busan | 2018 | 1345456 |
| 1 | Busan | 2019 | 1301422 |
| 2 | Busan | 2020 | 1314100 |
| 3 | Busan | 2021 | 1951909 |
| 4 | Chungcheongbuk-do | 2018 | 705419 |
| ... | ... | ... | ... |
| 63 | Seoul | 2021 | 7650244 |
| 64 | Ulsan | 2018 | 512512 |
| 65 | Ulsan | 2019 | 491191 |
| 66 | Ulsan | 2020 | 500742 |
| 67 | Ulsan | 2021 | 508688 |
68 rows × 3 columns
widedata로 만들었음. 일단 해!
df.set_index(['지역', '년도', '시도']).applymap(lambda x : str(x).replace(',','')).astype(int).reset_index()\
.rename(name_dict, axis = 1).drop(['BldgCount', 'Area'], axis = 1)\
.set_index(['Reg', 'Year', 'Prov']).stack().reset_index().rename({'level_3':'Type', 0:'EnergyUse'}, axis = 1)\
.pivot_table(index = ['Prov', 'Year', 'Type'], values = 'EnergyUse', aggfunc = 'sum').reset_index()| Prov | Year | Type | EnergyUse | |
|---|---|---|---|---|
| 0 | Busan | 2018 | Elec | 613522 |
| 1 | Busan | 2018 | Gas | 708240 |
| 2 | Busan | 2018 | Heat | 23694 |
| 3 | Busan | 2019 | Elec | 602980 |
| 4 | Busan | 2019 | Gas | 675882 |
| ... | ... | ... | ... | ... |
| 199 | Ulsan | 2020 | Gas | 306896 |
| 200 | Ulsan | 2020 | Heat | 0 |
| 201 | Ulsan | 2021 | Elec | 196412 |
| 202 | Ulsan | 2021 | Gas | 312276 |
| 203 | Ulsan | 2021 | Heat | 0 |
204 rows × 4 columns
큰 데이터와 작은 데이터가 만들어졌다.
big = df.set_index(['지역', '년도', '시도']).applymap(lambda x : str(x).replace(',','')).astype(int).reset_index()\
.rename(name_dict, axis = 1).drop(['BldgCount', 'Area'], axis = 1)\
.set_index(['Reg', 'Year', 'Prov']).stack().reset_index().rename({'level_3':'Type', 0:'EnergyUse'}, axis = 1)\
.pivot_table(index = ['Prov', 'Year', 'Type'], values = 'EnergyUse', aggfunc = 'sum').reset_index()

small = df.set_index(['지역', '년도', '시도']).applymap(lambda x : str(x).replace(',','')).astype(int).reset_index()\
.rename(name_dict, axis = 1).drop(['BldgCount', 'Area'], axis = 1)\
.set_index(['Reg', 'Year', 'Prov']).stack().reset_index().rename({'level_3':'Type', 0:'EnergyUse'}, axis = 1)\
.pivot_table(index = ['Prov', 'Year'], values = 'EnergyUse', aggfunc = 'sum').reset_index()
pd.merge(big, small, on = ['Year', 'Prov']).loc[lambda _df : _df['Type'] == 'Elec'].reset_index(drop = True)\
.assign(ElecRate = lambda _df : _df.EnergyUse_x / _df.EnergyUse_y)\
.drop(['EnergyUse_x', 'EnergyUse_y'], axis = 1)| Prov | Year | Type | ElecRate | |
|---|---|---|---|---|
| 0 | Busan | 2018 | Elec | 0.455996 |
| 1 | Busan | 2019 | Elec | 0.463324 |
| 2 | Busan | 2020 | Elec | 0.457401 |
| 3 | Busan | 2021 | Elec | 0.534566 |
| 4 | Chungcheongbuk-do | 2018 | Elec | 0.512447 |
| ... | ... | ... | ... | ... |
| 63 | Seoul | 2021 | Elec | 0.455675 |
| 64 | Ulsan | 2018 | Elec | 0.384385 |
| 65 | Ulsan | 2019 | Elec | 0.392067 |
| 66 | Ulsan | 2020 | Elec | 0.387118 |
| 67 | Ulsan | 2021 | Elec | 0.386115 |
68 rows × 4 columns
타이디데이터가 됐다.